Understand how the Consumer Price Index (CPI) measures inflation and learn to calculate relative price changes between any two years using official index data.
The CPI Calculator is a powerful tool for understanding the real value of money over time. Whether you are adjusting a salary for inflation, calculating the real return on an investment, or simply curious about how much a dollar was worth in the past, understanding index math and relative price change is essential. This calculator uses official Consumer Price Index (CPI-U) data to provide accurate inflation adjustments and purchasing power comparisons.

How to Use This Calculator
Our CPI Calculator is designed to be intuitive and precise. Follow these steps to calculate inflation rates and adjusted prices:
- Select Start Year: Choose the base year for your calculation. This is the year from which you want to measure the price change.
- Select End Year: Choose the target year. This is the year to which you are adjusting the price.
- Enter Item Price: Input the monetary value in the Start Year. This could be the price of a good, a salary, or any other financial figure.
- Calculate: Click the "Calculate Inflation" button to see the results.
The calculator will display the Adjusted Price (what the item would cost in the End Year), the Cumulative Inflation (total percentage change), and the Price Difference (the absolute dollar amount of the increase or decrease).
Understanding the Consumer Price Index (CPI)
The Consumer Price Index (CPI) is a measure of the average change over time in the prices paid by urban consumers for a market basket of consumer goods and services. It is produced by the Bureau of Labor Statistics (BLS) and is the most widely used measure of inflation in the United States.
What is the "Market Basket"?
The CPI is based on a "market basket" of goods and services that represents the spending habits of typical urban consumers. This basket includes:
- Food and Beverages: Cereal, milk, coffee, chicken, wine, full-service meals, snacks.
- Housing: Rent of primary residence, owners' equivalent rent, fuel oil, bedroom furniture.
- Apparel: Men's shirts and sweaters, women's dresses, jewelry.
- Transportation: New vehicles, airline fares, gasoline, motor vehicle insurance.
- Medical Care: Prescription drugs and medical supplies, physicians' services, eyeglasses and eye care, hospital services.
- Recreation: Televisions, toys, pets and pet products, sports equipment, admissions.
- Education and Communication: College tuition, postage, telephone services, computer software and accessories.
- Other Goods and Services: Tobacco and smoking products, haircuts and other personal services, funeral expenses.
The Math Behind the Index
The CPI is an index number, not a dollar amount. An index number allows us to compare the relative value of something over time. The BLS sets a specific period as the "base period" (currently 1982-1984), where the index is set to 100. All other years are measured relative to this base.
The Inflation Formula
To calculate the inflation rate between two years, we use the percentage change formula applied to the CPI values of those years.
Inflation Rate = ((CPITarget - CPISource) / CPISource) × 100
For example, if the CPI in 2000 was 172.2 and the CPI in 2024 is 313.7:
- Inflation Rate = ((313.7 - 172.2) / 172.2) × 100
- Inflation Rate = (141.5 / 172.2) × 100
- Inflation Rate ≈ 82.17%
Adjusting Prices for Inflation
To find out what a price from the past would be in today's dollars (or vice versa), we use the ratio of the CPIs.
Adjusted Price = Original Price × (CPITarget / CPISource)
Using the same example, if a movie ticket cost $5.00 in 2000:
- Adjusted Price = $5.00 × (313.7 / 172.2)
- Adjusted Price = $5.00 × 1.8217
- Adjusted Price ≈ $9.11
Why Relative Price Change Matters
Understanding relative price change is crucial for financial planning and economic analysis. It helps in:
- Salary Negotiations: Knowing if your raise kept up with inflation. If your salary increased by 3% but inflation was 5%, your real wage actually decreased.
- Investment Returns: Calculating the "real rate of return." A 7% return in a year with 4% inflation yields a real return of roughly 3%.
- Business Pricing: Adjusting product prices to maintain profit margins in an inflationary environment.
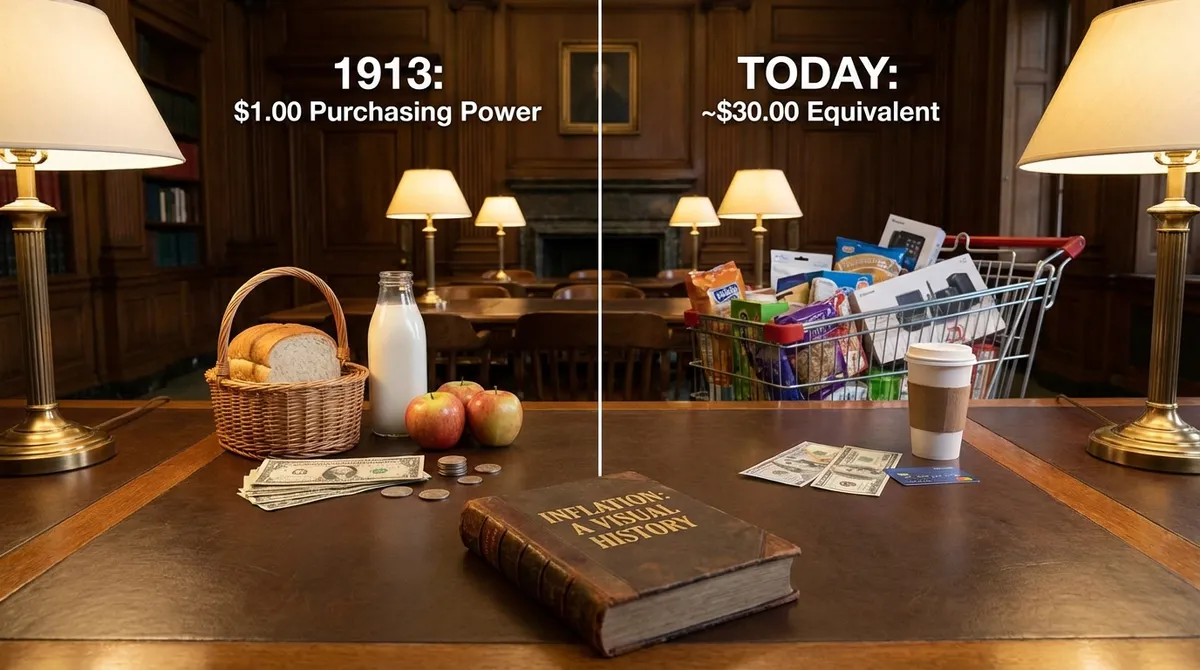
- Historical Comparisons: Comparing the cost of living between different eras. For instance, comparing the price of a Ford Model T in 1920 to a Ford F-150 today requires inflation adjustment to be meaningful.
Limitations of the CPI
While the CPI is the best available measure for general inflation, it has some limitations:
- Substitution Bias: Consumers may switch to cheaper alternatives when prices rise (e.g., buying chicken instead of beef). The fixed market basket might not immediately reflect this, potentially overstating the cost of living.
- Quality Changes: Improvements in product quality (e.g., smartphones getting faster and better cameras) can be difficult to quantify purely as price changes.
- New Products: It takes time for new products to be added to the market basket, meaning the CPI might lag in reflecting modern consumption habits.
- Individual Variability: The CPI represents an "average" urban consumer. Your personal inflation rate might differ depending on your spending habits (e.g., if you spend a lot on healthcare or education, which tend to inflate faster than average).
Related Calculators
If you found this tool useful, you might also be interested in our other inflation and finance calculators:
- Inflation Calculator: Calculate the value of money over time using historical data.
- US Inflation Calculator: Specifically focused on US CPI data with detailed breakdowns.
- Future Inflation Calculator: Project future costs based on estimated inflation rates.
- Currency Converter: Convert between different global currencies.
Hedonic Quality Adjustment: Is Your Phone Really Cheaper?
One of the most controversial aspects of the CPI is "hedonic quality adjustment." This methodology tries to account for improvements in the quality of goods.
For example, if a smartphone costs $800 in 2020 and $800 in 2024, the nominal price is the same. However, the 2024 phone has a better camera, faster processor, and more storage. The BLS might calculate that the price of "smartphone utility" has actually dropped because you are getting more for your money. While economically sound, critics argue this understates the actual cash layout required to maintain a standard of living, as you often cannot buy the "lower quality" version anymore.
Chained CPI vs. Standard CPI
You may hear about the "Chained CPI" (C-CPI-U) in discussions about government benefits. The standard CPI assumes a fixed basket of goods. The Chained CPI accounts for consumer substitution.
- The Logic: If the price of beef rises significantly, consumers might buy chicken instead. The Chained CPI reflects this change in behavior, typically resulting in a slightly lower inflation rate than the standard CPI.
- The Impact: This lower rate creates controversy when used to adjust Social Security benefits or tax brackets, as it results in smaller annual increases for recipients.
Calculating Your Personal Inflation Rate
The national CPI is an average. Your personal inflation rate depends on your unique spending basket.
- Students: If you pay for tuition and textbooks, your inflation rate is likely much higher than the national average, as education costs have skyrocketed.
- Commuters: If you drive a long distance, you are highly sensitive to gas prices.
- Homeowners vs. Renters: Fixed-rate mortgage holders are insulated from housing inflation (rent increases), whereas renters feel the full force of rising housing costs.
To calculate your personal rate, track your total expenses from one year to the next for the exact same lifestyle. (Year 2 Expenses - Year 1 Expenses) / Year 1 Expenses = Your Personal Inflation Rate.
The History of Hyperinflation
Inflation is usually a slow erosion of value, but sometimes it spirals out of control into hyperinflation (typically defined as prices rising 50% per month).
- Weimar Germany (1923): The most famous example, where prices doubled every few days. People burned cash for heat because it was cheaper than buying wood.
- Zimbabwe (2008): Reached an estimated inflation rate of 79.6 billion percent month-on-month. The government issued 100-trillion-dollar notes that were worthless.
- Venezuela (2016-Present): Economic mismanagement led to sustained hyperinflation, destroying savings and leading to a switch to US dollars for transactions.
These examples highlight the importance of a stable central bank derived monetary policy to maintain the value of currency.
Frequently Asked Questions (FAQ)
Conclusion
The CPI Calculator is an essential tool for navigating an economy where prices are constantly changing. By understanding index math and relative price changes, you can make more informed decisions about your money, negotiate better salaries, and truly understand the value of a dollar. Use this tool to cut through the noise of nominal prices and see the real economic picture.
For more detailed economic data, you can visit the Bureau of Economic Analysis or the Federal Reserve.